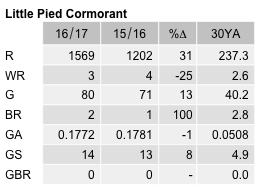
Little Pied Cormorant
Microcarbo melanoleucos
ABR description
The following is extracted from the Annual Bird Report for the twelve months to June 2017.
Common breeding resident
Can be regularly found on the various bodies of water in and around Canberra.
General: By far our most commonly recorded cormorant and the most widespread (from 84 grid cells). 1595 records this year, incl 4 WOO, and the recording rate of 11.3% is 29% up on the 30YA of 8.7%. The abundance value of A= 0.3516 was up 72% on the 30YA. Numbers ranged from 1-80 (80/12 Mar Foxlow Lagoon GrS18 (BuM1)), average 3.2, median 1. Recorded in every week of the year, with 20% of records in winter, 14% spring, 32% summer and 35% autumn. 1 breeding event: on/20 Apr and ny/4 May Molonglo R GrJ14 (CaJ4).
GBS: 203 records, same as last year, at a reporting rate of 7.9%, well up on the 30YA of 2.2%. Recorded evenly over 52 weeks. Numbers ranged from 1 to 12/5 Mar Murrumbateman GrI06 (BlJ1). They were recorded from 14 sites, both urban and rural, but were reasonably common only in Red Hill, Curtin and Giralang.
Abundance
Abundance is the average number of birds of that species per survey. Where the species was observed (presence recorded) but the number of birds seen was not recorded, this is treated as a count of zero.
Abundance by year
This chart shows the abundance of Little Pied Cormorant between 1982 and 2017. 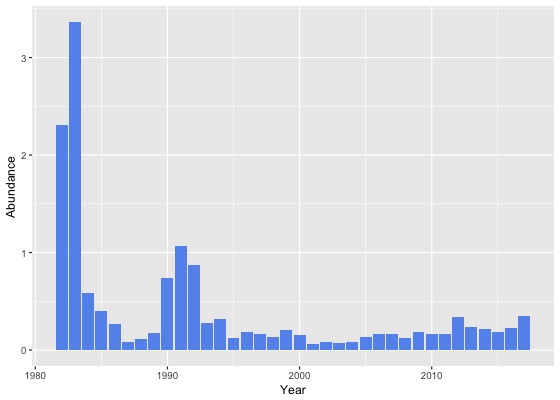
Abundance by month
This chart shows the monthly abundance of Little Pied Cormorant. The blue lines show the abundance for the twelve months to June 2017 and the bars show the average abundance for the period 1982 to 2017. 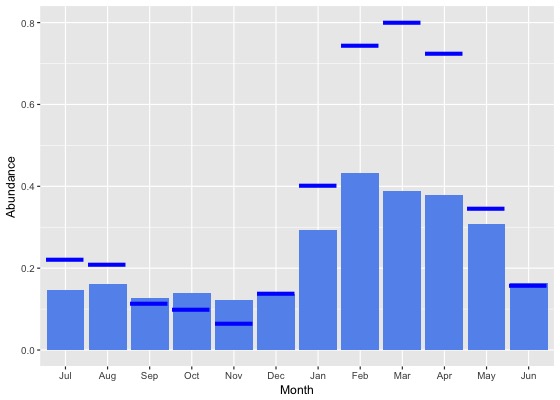
Abundance by season
This chart shows the seasonal abundance of Little Pied Cormorant. The blue lines show the seasonal abundance for the twelve months to June 2017 and the bars show the average seasonal abundance for the period 1982 to 2017. 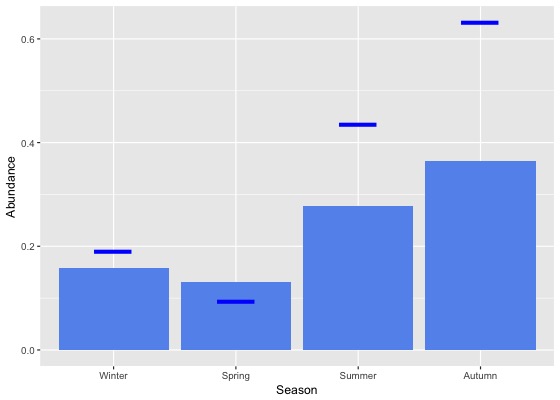
Abundance data
| Month | Season | ||||||||||||||||||
|---|---|---|---|---|---|---|---|---|---|---|---|---|---|---|---|---|---|---|---|
| Period | Jul | Aug | Sep | Oct | Nov | Dec | Jan | Feb | Mar | Apr | May | Jun | Winter | Spring | Summer | Autumn | All | ||
| All years | |||||||||||||||||||
| All | 0.1 | 0.2 | 0.1 | 0.1 | 0.1 | 0.1 | 0.3 | 0.4 | 0.4 | 0.4 | 0.3 | 0.2 | 0.2 | 0.1 | 0.3 | 0.4 | 0.2 | ||
| Previous years | |||||||||||||||||||
| All previous years | 0.1 | 0.2 | 0.1 | 0.1 | 0.1 | 0.1 | 0.3 | 0.4 | 0.3 | 0.3 | 0.3 | 0.2 | 0.2 | 0.1 | 0.3 | 0.3 | 0.2 | ||
| Previous 30 years | 0.1 | 0.1 | 0.1 | 0.1 | 0.1 | 0.1 | 0.3 | 0.3 | 0.3 | 0.3 | 0.3 | 0.1 | 0.1 | 0.1 | 0.2 | 0.3 | 0.2 | ||
| Previous 20 years | 0.1 | 0.1 | 0.1 | 0.1 | 0.1 | 0.1 | 0.3 | 0.3 | 0.3 | 0.2 | 0.3 | 0.1 | 0.1 | 0.1 | 0.2 | 0.3 | 0.2 | ||
| 10 year groups | |||||||||||||||||||
| [2007,2017) | 0.1 | 0.1 | 0.1 | 0.2 | 0.1 | 0.1 | 0.3 | 0.3 | 0.3 | 0.3 | 0.3 | 0.2 | 0.1 | 0.1 | 0.2 | 0.3 | 0.2 | ||
| [1997,2007) | 0.1 | 0.1 | 0.1 | 0.1 | 0.1 | 0.1 | 0.3 | 0.2 | 0.1 | 0.2 | 0.2 | 0.1 | 0.1 | 0.1 | 0.2 | 0.2 | 0.1 | ||
| [1987,1997) | 0.2 | 0.2 | 0.3 | 0.2 | 0.2 | 0.2 | 0.3 | 0.5 | 0.5 | 0.7 | 0.3 | 0.2 | 0.2 | 0.2 | 0.4 | 0.5 | 0.3 | ||
| 5 year groups | |||||||||||||||||||
| [2012,2017) | 0.1 | 0.1 | 0.1 | 0.1 | 0.2 | 0.2 | 0.3 | 0.4 | 0.4 | 0.3 | 0.4 | 0.2 | 0.2 | 0.1 | 0.3 | 0.4 | 0.2 | ||
| [2007,2012) | 0.1 | 0.2 | 0.1 | 0.2 | 0.1 | 0.1 | 0.2 | 0.3 | 0.2 | 0.2 | 0.2 | 0.1 | 0.1 | 0.2 | 0.2 | 0.2 | 0.2 | ||
| [2002,2007) | 0.1 | 0.1 | 0.1 | 0.1 | 0.1 | 0.1 | 0.3 | 0.2 | 0.1 | 0.2 | 0.2 | 0.1 | 0.1 | 0.1 | 0.2 | 0.1 | 0.1 | ||
| [1997,2002) | 0.2 | 0.1 | 0.1 | 0.1 | 0.1 | 0.1 | 0.3 | 0.2 | 0.2 | 0.1 | 0.2 | 0.1 | 0.1 | 0.1 | 0.2 | 0.2 | 0.1 | ||
| [1992,1997) | 0.3 | 0.2 | 0.4 | 0.2 | 0.4 | 0.3 | 0.2 | 0.7 | 0.4 | 0.6 | 0.2 | 0.1 | 0.2 | 0.3 | 0.4 | 0.4 | 0.3 | ||
| [1987,1992) | 0.1 | 0.2 | 0.2 | 0.1 | 0.0 | 0.2 | 0.4 | 0.5 | 0.7 | 0.7 | 0.3 | 0.3 | 0.2 | 0.1 | 0.4 | 0.6 | 0.3 | ||
| Year | |||||||||||||||||||
| 2017 | 0.2 | 0.2 | 0.1 | 0.1 | 0.1 | 0.1 | 0.4 | 0.7 | 0.8 | 0.7 | 0.3 | 0.2 | 0.2 | 0.1 | 0.4 | 0.6 | 0.4 | ||
| 2016 | 0.1 | 0.1 | 0.1 | 0.1 | 0.1 | 0.2 | 0.3 | 0.3 | 0.3 | 0.4 | 0.4 | 0.2 | 0.1 | 0.1 | 0.3 | 0.3 | 0.2 | ||
| 2015 | 0.2 | 0.2 | 0.1 | 0.1 | 0.1 | 0.1 | 0.2 | 0.3 | 0.2 | 0.2 | 0.3 | 0.2 | 0.2 | 0.1 | 0.2 | 0.2 | 0.2 | ||
| 2014 | 0.2 | 0.1 | 0.0 | 0.1 | 0.1 | 0.1 | 0.2 | 0.6 | 0.3 | 0.2 | 0.3 | 0.3 | 0.2 | 0.1 | 0.3 | 0.3 | 0.2 | ||
| 2013 | 0.1 | 0.1 | 0.1 | 0.1 | 0.3 | 0.2 | 0.3 | 0.3 | 0.4 | 0.3 | 0.4 | 0.1 | 0.1 | 0.1 | 0.3 | 0.4 | 0.2 | ||
| 2012 | 0.1 | 0.1 | 0.1 | 0.2 | 0.2 | 0.3 | 0.4 | 0.4 | 1.2 | 0.5 | 0.8 | 0.1 | 0.1 | 0.2 | 0.4 | 0.8 | 0.3 | ||
| 2011 | 0.1 | 0.2 | 0.2 | 0.2 | 0.1 | 0.2 | 0.1 | 0.4 | 0.2 | 0.2 | 0.1 | 0.1 | 0.1 | 0.2 | 0.2 | 0.2 | 0.2 | ||
| 2010 | 0.0 | 0.1 | 0.1 | 0.2 | 0.0 | 0.1 | 0.2 | 0.5 | 0.3 | 0.1 | 0.4 | 0.0 | 0.1 | 0.2 | 0.2 | 0.3 | 0.2 | ||
| 2009 | 0.1 | 0.6 | 0.1 | 0.3 | 0.1 | 0.0 | 0.2 | 0.2 | 0.3 | 0.1 | 0.3 | 0.1 | 0.2 | 0.2 | 0.1 | 0.2 | 0.2 | ||
| 2008 | 0.1 | 0.1 | 0.1 | 0.1 | 0.1 | 0.0 | 0.2 | 0.2 | 0.1 | 0.1 | 0.3 | 0.2 | 0.1 | 0.1 | 0.1 | 0.2 | 0.1 | ||
| 2007 | 0.1 | 0.1 | 0.1 | 0.3 | 0.1 | 0.1 | 0.3 | 0.1 | 0.2 | 0.2 | 0.2 | 0.1 | 0.1 | 0.2 | 0.2 | 0.2 | 0.2 | ||
| 2006 | 0.1 | 0.0 | 0.1 | 0.0 | 0.0 | 0.1 | 0.3 | 0.3 | 0.1 | 0.6 | 0.4 | 0.2 | 0.1 | 0.0 | 0.2 | 0.3 | 0.2 | ||
| 2005 | 0.1 | 0.2 | 0.1 | 0.1 | 0.1 | 0.1 | 0.5 | 0.5 | 0.1 | 0.1 | 0.2 | 0.0 | 0.1 | 0.1 | 0.3 | 0.1 | 0.1 | ||
| 2004 | 0.1 | 0.0 | 0.0 | 0.1 | 0.1 | 0.0 | 0.2 | 0.2 | 0.0 | 0.1 | 0.2 | 0.1 | 0.0 | 0.1 | 0.1 | 0.1 | 0.1 | ||
| 2003 | 0.1 | 0.1 | 0.1 | 0.0 | 0.0 | 0.0 | 0.0 | 0.0 | 0.1 | 0.2 | 0.1 | 0.1 | 0.1 | 0.1 | 0.0 | 0.1 | 0.1 | ||
| 2002 | 0.1 | 0.1 | 0.1 | 0.1 | 0.1 | 0.0 | 0.2 | 0.3 | 0.0 | 0.1 | 0.1 | 0.1 | 0.1 | 0.1 | 0.1 | 0.1 | 0.1 | ||
| 2001 | 0.0 | 0.0 | 0.0 | 0.1 | 0.0 | 0.0 | 0.1 | 0.1 | 0.1 | 0.1 | 0.1 | 0.0 | 0.0 | 0.0 | 0.1 | 0.1 | 0.1 | ||
| 2000 | 0.4 | 0.3 | 0.2 | 0.1 | 0.1 | 0.1 | 0.2 | 0.2 | 0.1 | 0.1 | 0.1 | 0.0 | 0.2 | 0.1 | 0.2 | 0.1 | 0.2 | ||
| 1999 | 0.1 | 0.1 | 0.0 | 0.0 | 0.0 | 0.1 | 0.4 | 0.6 | 0.4 | 0.1 | 0.3 | 0.2 | 0.2 | 0.0 | 0.4 | 0.3 | 0.2 | ||
| 1998 | 0.0 | 0.0 | 0.1 | 0.0 | 0.0 | 0.1 | 0.4 | 0.2 | 0.2 | 0.1 | 0.3 | 0.2 | 0.1 | 0.1 | 0.2 | 0.2 | 0.1 | ||
| 1997 | 0.2 | 0.0 | 0.1 | 0.1 | 0.3 | 0.1 | 0.3 | 0.2 | 0.7 | 0.1 | 0.1 | 0.1 | 0.1 | 0.2 | 0.2 | 0.2 | 0.2 | ||
| 1996 | 0.1 | 0.0 | 0.1 | 0.0 | 0.6 | 0.3 | 0.2 | 0.1 | 0.1 | 0.4 | 0.2 | 0.1 | 0.1 | 0.2 | 0.2 | 0.2 | 0.2 | ||
| 1995 | 0.3 | 0.2 | 0.0 | 0.2 | 0.1 | 0.1 | 0.1 | 0.2 | 0.1 | 0.1 | 0.0 | 0.0 | 0.2 | 0.1 | 0.1 | 0.1 | 0.1 | ||
| 1994 | 0.8 | 0.3 | 0.1 | 0.0 | 0.1 | 0.4 | 0.2 | 0.4 | 0.4 | 0.9 | 0.2 | 0.1 | 0.3 | 0.1 | 0.3 | 0.6 | 0.3 | ||
| 1993 | 0.3 | 0.1 | 0.2 | 0.1 | 0.5 | 0.0 | 0.2 | 0.2 | 0.4 | 1.1 | 0.1 | 0.2 | 0.2 | 0.3 | 0.1 | 0.5 | 0.3 | ||
| 1992 | 0.2 | 0.1 | 1.6 | 0.9 | 1.2 | 0.5 | 0.7 | 3.8 | 1.0 | 0.4 | 0.5 | 0.1 | 0.2 | 1.2 | 1.4 | 0.7 | 0.9 | ||
| 1991 | 0.2 | 0.3 | 0.8 | 0.4 | 0.2 | 0.6 | 2.5 | 3.3 | 4.3 | 2.3 | 0.5 | 0.3 | 0.2 | 0.5 | 2.0 | 2.4 | 1.1 | ||
| 1990 | 0.2 | 0.1 | 0.2 | 0.2 | 0.1 | 1.0 | 1.6 | 1.0 | 1.7 | 3.2 | 0.5 | 0.8 | 0.3 | 0.1 | 1.2 | 1.9 | 0.7 | ||
| 1989 | 0.1 | 0.2 | 0.1 | 0.1 | 0.0 | 0.1 | 0.0 | 0.3 | 0.2 | 0.3 | 0.7 | 0.2 | 0.2 | 0.1 | 0.1 | 0.4 | 0.2 | ||
| 1988 | 0.1 | 0.2 | 0.1 | 0.1 | 0.0 | 0.1 | 0.1 | 0.1 | 0.1 | 0.3 | 0.1 | 0.2 | 0.1 | 0.1 | 0.1 | 0.2 | 0.1 | ||
| 1987 | 0.1 | 0.1 | 0.1 | 0.1 | 0.0 | 0.0 | 0.0 | 0.1 | 0.1 | 0.1 | 0.1 | 0.2 | 0.2 | 0.1 | 0.1 | 0.1 | 0.1 | ||
| 1986 | 0.3 | 0.1 | 0.2 | 0.2 | 0.1 | 0.4 | 0.0 | 0.2 | 0.4 | 0.6 | 0.4 | 0.4 | 0.2 | 0.1 | 0.2 | 0.5 | 0.3 | ||
| 1985 | 0.0 | 0.2 | 0.2 | 0.3 | 0.0 | 0.3 | 0.0 | 2.6 | 0.1 | 1.8 | 0.2 | 0.5 | 0.2 | 0.2 | 0.8 | 0.9 | 0.4 | ||
| 1984 | 0.0 | 4.0 | 0.0 | 0.3 | 0.0 | 0.0 | 0.0 | 0.4 | 0.0 | 1.0 | 0.2 | 1.2 | 1.6 | 0.2 | 0.2 | 0.4 | 0.6 | ||
| 1983 | 1.3 | 4.0 | 1.0 | 3.8 | 2.0 | 3.8 | 2.5 | 5.6 | 1.0 | - | 4.4 | 2.4 | 2.8 | 2.7 | 4.2 | 3.9 | 3.4 | ||
| 1982 | - | 0.3 | - | 0.0 | 0.6 | 0.4 | - | 1.5 | - | 5.7 | - | 4.4 | 2.6 | 0.6 | 0.9 | 5.7 | 2.3 | ||
Reporting rates
Reporting rate is the proportion of all surveys in which the species was present.
Reporting rate by year
This chart shows the reporting rate of Little Pied Cormorant each year between 1982 and 2017. 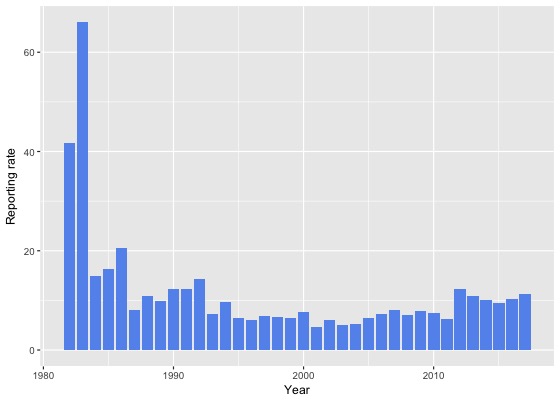
Reporting rate by month
This chart shows the reporting rate by month of Little Pied Cormorant. The blue lines show the reporting rate for the twelve months to June 2017 and the bars show the average reporting rate for the period 1982 to 2017. 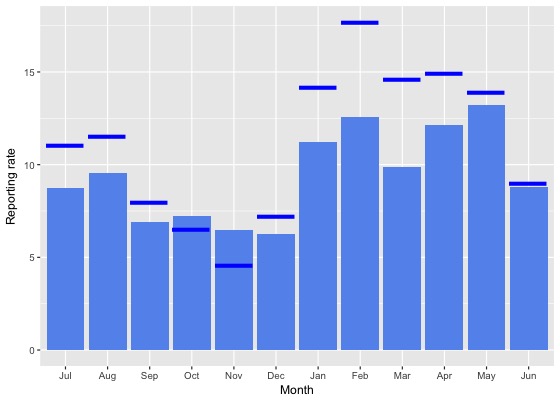
Reporting rate by season
This chart shows the seasonal reporting rate of Little Pied Cormorant. The blue lines show the seasonal reporting rate for the twelve months to June 2017 and the bars show the average seasonal reporting rate for the period 1982 to 2017. 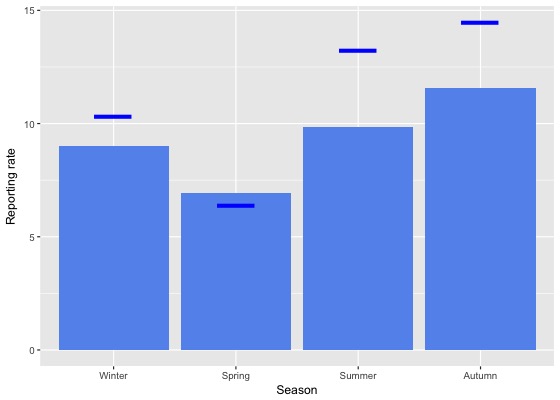
Reporting rate data
| Month | Season | ||||||||||||||||||
|---|---|---|---|---|---|---|---|---|---|---|---|---|---|---|---|---|---|---|---|
| Period | Jul | Aug | Sep | Oct | Nov | Dec | Jan | Feb | Mar | Apr | May | Jun | Winter | Spring | Summer | Autumn | All | ||
| All years | |||||||||||||||||||
| All | 8.8 | 9.6 | 6.9 | 7.2 | 6.5 | 6.3 | 11.2 | 12.6 | 9.9 | 12.2 | 13.2 | 8.8 | 9.0 | 6.9 | 9.9 | 11.6 | 9.3 | ||
| Previous years | |||||||||||||||||||
| All previous years | 8.4 | 9.2 | 6.7 | 7.3 | 6.8 | 6.1 | 10.7 | 11.5 | 9.1 | 11.7 | 13.1 | 8.7 | 8.8 | 7.0 | 9.3 | 11.0 | 8.9 | ||
| Previous 30 years | 8.3 | 8.8 | 6.6 | 7.1 | 6.7 | 5.9 | 10.7 | 11.2 | 9.0 | 11.1 | 12.9 | 8.3 | 8.5 | 6.8 | 9.1 | 10.7 | 8.7 | ||
| Previous 20 years | 7.8 | 7.8 | 5.9 | 7.1 | 7.6 | 6.1 | 11.4 | 11.1 | 8.6 | 10.1 | 13.1 | 7.5 | 7.7 | 6.9 | 9.4 | 10.3 | 8.5 | ||
| 10 year groups | |||||||||||||||||||
| [2007,2017) | 9.0 | 8.6 | 6.7 | 7.5 | 8.7 | 7.2 | 11.9 | 12.4 | 10.0 | 11.2 | 14.4 | 8.7 | 8.7 | 7.5 | 10.5 | 11.5 | 9.5 | ||
| [1997,2007) | 5.9 | 6.2 | 4.4 | 5.9 | 5.4 | 4.1 | 9.5 | 7.6 | 5.8 | 7.3 | 9.9 | 5.0 | 5.6 | 5.2 | 6.6 | 7.3 | 6.2 | ||
| [1987,1997) | 10.1 | 11.9 | 9.8 | 6.9 | 3.9 | 5.0 | 6.8 | 11.4 | 11.2 | 16.1 | 12.1 | 12.6 | 11.6 | 6.7 | 7.6 | 13.2 | 9.6 | ||
| 5 year groups | |||||||||||||||||||
| [2012,2017) | 10.0 | 8.8 | 6.8 | 7.3 | 8.8 | 8.6 | 12.1 | 13.3 | 11.1 | 12.9 | 15.7 | 10.9 | 10.0 | 7.5 | 11.4 | 12.9 | 10.4 | ||
| [2007,2012) | 5.9 | 7.9 | 6.5 | 7.8 | 8.4 | 4.1 | 11.3 | 8.8 | 6.7 | 7.3 | 10.8 | 4.7 | 5.7 | 7.6 | 7.7 | 7.9 | 7.3 | ||
| [2002,2007) | 5.6 | 4.8 | 4.5 | 5.8 | 6.0 | 3.8 | 10.8 | 7.1 | 5.0 | 7.9 | 11.1 | 4.0 | 4.8 | 5.4 | 6.7 | 7.4 | 6.1 | ||
| [1997,2002) | 6.3 | 7.8 | 4.4 | 6.1 | 4.8 | 4.4 | 8.0 | 8.1 | 6.7 | 6.6 | 8.3 | 6.4 | 6.8 | 5.0 | 6.6 | 7.0 | 6.3 | ||
| [1992,1997) | 10.5 | 9.0 | 7.4 | 6.4 | 6.3 | 5.9 | 7.9 | 10.0 | 9.3 | 13.5 | 9.8 | 6.3 | 8.5 | 6.6 | 7.8 | 10.9 | 8.4 | ||
| [1987,1992) | 10.0 | 13.5 | 10.9 | 7.2 | 2.7 | 4.6 | 6.2 | 11.9 | 12.3 | 17.6 | 13.3 | 16.2 | 13.2 | 6.7 | 7.5 | 14.4 | 10.2 | ||
| Year | |||||||||||||||||||
| 2017 | 11.1 | 11.5 | 8.0 | 6.5 | 4.6 | 7.2 | 14.2 | 17.7 | 14.6 | 14.9 | 13.9 | 9.0 | 10.3 | 6.4 | 13.2 | 14.5 | 11.3 | ||
| 2016 | 8.6 | 6.9 | 7.3 | 7.0 | 8.0 | 8.6 | 11.5 | 11.7 | 10.9 | 14.8 | 15.2 | 12.2 | 9.1 | 7.4 | 10.8 | 13.5 | 10.3 | ||
| 2015 | 12.4 | 13.0 | 7.7 | 8.6 | 6.9 | 7.3 | 8.3 | 10.9 | 9.5 | 9.7 | 14.5 | 8.7 | 10.9 | 7.8 | 8.8 | 10.9 | 9.5 | ||
| 2014 | 11.5 | 7.1 | 3.4 | 6.0 | 4.4 | 6.0 | 12.7 | 15.9 | 10.7 | 9.7 | 14.3 | 16.2 | 12.5 | 4.9 | 12.3 | 11.2 | 10.0 | ||
| 2013 | 11.4 | 10.4 | 7.7 | 5.2 | 9.5 | 7.4 | 13.1 | 16.1 | 12.5 | 17.0 | 20.1 | 8.3 | 9.9 | 7.1 | 11.5 | 15.7 | 11.0 | ||
| 2012 | 7.5 | 7.5 | 6.1 | 9.0 | 16.4 | 14.8 | 17.8 | 20.0 | 14.3 | 12.1 | 17.6 | 8.7 | 8.0 | 10.0 | 17.2 | 14.1 | 12.3 | ||
| 2011 | 8.1 | 7.2 | 7.0 | 5.7 | 7.3 | 4.2 | 10.9 | 6.8 | 5.3 | 6.3 | 6.2 | 2.9 | 4.9 | 6.3 | 7.4 | 5.9 | 6.2 | ||
| 2010 | 3.1 | 6.1 | 7.5 | 9.7 | 6.2 | 4.0 | 9.7 | 15.3 | 6.7 | 6.8 | 16.7 | 4.6 | 4.7 | 8.3 | 7.8 | 8.5 | 7.6 | ||
| 2009 | 7.2 | 13.5 | 7.1 | 7.6 | 8.9 | 4.2 | 12.7 | 7.5 | 8.8 | 7.0 | 13.7 | 3.6 | 6.8 | 7.7 | 7.8 | 9.2 | 7.9 | ||
| 2008 | 3.4 | 7.0 | 7.9 | 7.0 | 7.4 | 3.6 | 13.5 | 10.2 | 5.4 | 6.2 | 13.5 | 6.5 | 5.7 | 7.3 | 7.9 | 7.3 | 7.1 | ||
| 2007 | 7.7 | 6.5 | 2.5 | 9.7 | 12.8 | 4.4 | 11.4 | 7.8 | 7.7 | 11.1 | 10.6 | 6.2 | 6.5 | 8.2 | 7.6 | 9.6 | 8.1 | ||
| 2006 | 7.9 | 3.9 | 2.2 | 2.8 | 3.6 | 1.7 | 15.2 | 11.9 | 7.3 | 16.7 | 18.8 | 5.0 | 5.6 | 2.8 | 9.3 | 12.3 | 7.3 | ||
| 2005 | 5.9 | 6.5 | 4.1 | 5.5 | 8.3 | 3.6 | 12.8 | 8.7 | 4.3 | 6.6 | 14.9 | 3.4 | 4.8 | 5.5 | 7.2 | 8.5 | 6.5 | ||
| 2004 | 3.6 | 3.3 | 5.3 | 9.3 | 4.7 | 4.1 | 10.3 | 6.1 | 3.1 | 3.8 | 6.8 | 4.9 | 3.9 | 6.3 | 6.7 | 4.2 | 5.2 | ||
| 2003 | 6.0 | 5.8 | 5.5 | 6.7 | 8.3 | 2.1 | 4.4 | 3.3 | 4.5 | 6.5 | 3.9 | 3.1 | 4.8 | 6.8 | 3.1 | 5.1 | 5.0 | ||
| 2002 | 6.3 | 5.1 | 5.5 | 7.7 | 5.0 | 5.9 | 10.1 | 7.2 | 4.5 | 6.0 | 5.9 | 3.2 | 4.8 | 6.2 | 7.2 | 5.3 | 6.0 | ||
| 2001 | 3.1 | 6.6 | 2.7 | 5.5 | 5.1 | 2.5 | 6.0 | 7.2 | 4.8 | 3.9 | 5.2 | 4.4 | 4.5 | 4.1 | 4.9 | 4.6 | 4.6 | ||
| 2000 | 8.7 | 14.4 | 5.6 | 8.4 | 7.9 | 5.7 | 8.7 | 7.6 | 7.8 | 8.0 | 8.2 | 4.8 | 9.0 | 7.3 | 7.2 | 7.9 | 7.7 | ||
| 1999 | 5.9 | 5.2 | 2.9 | 5.0 | 1.3 | 3.8 | 6.6 | 9.3 | 8.6 | 7.2 | 10.8 | 8.4 | 7.2 | 3.1 | 6.4 | 8.8 | 6.4 | ||
| 1998 | 2.7 | 1.9 | 8.1 | 1.1 | 1.8 | 6.6 | 16.2 | 9.4 | 5.4 | 10.3 | 14.8 | 10.7 | 6.1 | 4.0 | 10.1 | 8.2 | 6.7 | ||
| 1997 | 12.6 | 3.4 | 5.5 | 9.2 | 6.0 | 4.8 | 5.9 | 8.8 | 10.0 | 6.4 | 6.7 | 5.6 | 7.8 | 6.6 | 6.1 | 7.2 | 6.9 | ||
| 1996 | 7.5 | 3.2 | 4.0 | 0.0 | 5.6 | 7.1 | 7.8 | 3.5 | 4.9 | 12.5 | 17.2 | 6.9 | 5.6 | 3.0 | 6.3 | 10.3 | 6.1 | ||
| 1995 | 9.7 | 8.5 | 2.9 | 7.9 | 3.6 | 4.6 | 5.3 | 7.9 | 6.1 | 8.9 | 5.2 | 4.3 | 7.6 | 5.3 | 5.7 | 7.0 | 6.4 | ||
| 1994 | 15.7 | 16.9 | 10.3 | 1.2 | 3.7 | 4.3 | 10.3 | 10.3 | 13.6 | 16.0 | 10.0 | 5.6 | 12.0 | 4.5 | 8.7 | 13.7 | 9.7 | ||
| 1993 | 8.2 | 5.1 | 4.8 | 10.7 | 7.6 | 2.2 | 4.1 | 9.4 | 7.4 | 18.3 | 3.9 | 5.8 | 6.1 | 7.9 | 4.7 | 9.2 | 7.3 | ||
| 1992 | 12.3 | 14.8 | 15.3 | 12.8 | 15.3 | 9.5 | 13.8 | 26.8 | 16.9 | 13.6 | 14.5 | 10.0 | 12.3 | 14.3 | 15.4 | 15.0 | 14.3 | ||
| 1991 | 3.9 | 10.6 | 10.5 | 7.8 | 5.2 | 8.1 | 21.4 | 18.0 | 15.9 | 25.4 | 26.2 | 18.0 | 8.9 | 7.7 | 15.0 | 22.4 | 12.4 | ||
| 1990 | 10.3 | 11.9 | 8.6 | 11.2 | 1.9 | 8.3 | 8.3 | 15.5 | 18.2 | 25.0 | 15.1 | 19.7 | 12.7 | 7.0 | 10.7 | 19.6 | 12.4 | ||
| 1989 | 10.7 | 15.1 | 10.9 | 5.0 | 2.5 | 3.9 | 4.3 | 14.9 | 12.8 | 16.4 | 10.5 | 13.1 | 13.1 | 6.3 | 7.5 | 13.5 | 9.8 | ||
| 1988 | 12.1 | 14.6 | 14.6 | 8.2 | 4.2 | 6.2 | 6.0 | 10.9 | 10.9 | 19.3 | 11.1 | 15.9 | 14.1 | 8.2 | 7.6 | 13.6 | 10.9 | ||
| 1987 | 18.2 | 6.7 | 9.3 | 6.6 | 1.2 | 1.4 | 3.1 | 7.9 | 9.6 | 12.8 | 13.1 | 17.2 | 16.5 | 5.3 | 4.3 | 11.9 | 8.0 | ||
| 1986 | 26.9 | 7.9 | 18.9 | 11.1 | 6.4 | 11.8 | 4.3 | 19.4 | 29.0 | 45.1 | 37.9 | 22.9 | 18.2 | 12.5 | 12.9 | 38.7 | 20.5 | ||
| 1985 | 0.0 | 13.3 | 15.4 | 18.6 | 1.8 | 13.3 | 0.0 | 41.2 | 9.1 | 63.2 | 20.0 | 28.6 | 13.6 | 12.8 | 17.6 | 37.5 | 16.4 | ||
| 1984 | 0.0 | 60.0 | 0.0 | 25.0 | 0.0 | 0.0 | 3.4 | 9.1 | 0.0 | 38.2 | 6.5 | 20.6 | 26.5 | 14.3 | 5.4 | 16.3 | 14.8 | ||
| 1983 | 33.3 | 91.7 | 60.0 | 84.6 | 77.8 | 76.9 | 33.3 | 72.7 | 50.0 | - | 41.7 | 54.5 | 65.5 | 77.8 | 66.7 | 42.9 | 66.0 | ||
| 1982 | - | 18.2 | - | 0.0 | 25.0 | 14.3 | - | 45.5 | - | 76.9 | - | 64.3 | 44.0 | 22.2 | 28.0 | 76.9 | 41.7 | ||
Breeding data
Breeding records by month
Number of breeding records by breeding code and month, 2017 and all years| Breeding code | Jul | Aug | Sep | Oct | Nov | Dec | Jan | Feb | Mar | Apr | May | Jun |
|---|---|---|---|---|---|---|---|---|---|---|---|---|
| 2017 | ||||||||||||
| Breeding (BLA code) | 0 | 0 | 0 | 0 | 0 | 0 | 0 | 0 | 0 | 0 | 0 | 0 |
| Carrying Food | 0 | 0 | 0 | 0 | 0 | 0 | 0 | 0 | 0 | 0 | 0 | 0 |
| Copulating | 0 | 0 | 0 | 0 | 0 | 0 | 0 | 0 | 0 | 0 | 0 | 0 |
| Display | 0 | 0 | 0 | 0 | 0 | 0 | 0 | 0 | 0 | 0 | 0 | 0 |
| Dependent young | 0 | 0 | 0 | 0 | 0 | 0 | 0 | 0 | 0 | 0 | 0 | 0 |
| Faecal sac | 0 | 0 | 0 | 0 | 0 | 0 | 0 | 0 | 0 | 0 | 0 | 0 |
| Inspecting hollow | 0 | 0 | 0 | 0 | 0 | 0 | 0 | 0 | 0 | 0 | 0 | 0 |
| Nest building | 0 | 0 | 0 | 0 | 0 | 0 | 0 | 0 | 0 | 0 | 0 | 0 |
| Nest with eggs | 0 | 0 | 0 | 0 | 0 | 0 | 0 | 0 | 0 | 0 | 0 | 0 |
| Nest with young | 0 | 0 | 0 | 0 | 0 | 0 | 0 | 0 | 0 | 0 | 1 | 0 |
| On/leaving nest | 0 | 0 | 0 | 0 | 0 | 0 | 0 | 0 | 0 | 1 | 0 | 0 |
| All years | ||||||||||||
| Breeding (BLA code) | 0 | 0 | 0 | 0 | 1 | 0 | 1 | 1 | 0 | 0 | 0 | 0 |
| Carrying Food | 0 | 0 | 0 | 0 | 0 | 0 | 0 | 0 | 0 | 0 | 0 | 0 |
| Copulating | 0 | 0 | 0 | 0 | 0 | 0 | 0 | 0 | 0 | 0 | 0 | 0 |
| Display | 0 | 0 | 1 | 1 | 0 | 0 | 0 | 0 | 0 | 0 | 0 | 0 |
| Dependent young | 0 | 0 | 0 | 0 | 0 | 2 | 2 | 3 | 1 | 0 | 0 | 0 |
| Faecal sac | 0 | 0 | 0 | 0 | 0 | 0 | 0 | 0 | 0 | 0 | 0 | 0 |
| Inspecting hollow | 0 | 0 | 0 | 0 | 0 | 0 | 0 | 0 | 0 | 0 | 0 | 0 |
| Nest building | 0 | 0 | 0 | 1 | 0 | 0 | 1 | 0 | 0 | 0 | 0 | 0 |
| Nest with eggs | 0 | 0 | 1 | 0 | 1 | 0 | 0 | 0 | 0 | 0 | 0 | 0 |
| Nest with young | 0 | 0 | 2 | 2 | 2 | 4 | 5 | 2 | 4 | 1 | 1 | 0 |
| On/leaving nest | 0 | 1 | 5 | 13 | 8 | 3 | 4 | 5 | 3 | 3 | 0 | 0 |
Breeding records by year
Average number of breeding records per period by breeding code| Period | Breeding (BLA code) | Carrying Food | Copulating | Display | Dependent young | Faecal sac | Inspecting hollow | Nest building | Nest with eggs | Nest with young | On/leaving nest |
|---|---|---|---|---|---|---|---|---|---|---|---|
| All years | |||||||||||
| All | 0.1 | 0.0 | 0.0 | 0.1 | 0.2 | 0.0 | 0.0 | 0.1 | 0.1 | 0.6 | 1.2 |
| Previous years | |||||||||||
| All previous years | 0.1 | 0.0 | 0.0 | 0.1 | 0.2 | 0.0 | 0.0 | 0.1 | 0.1 | 0.6 | 1.3 |
| Previous 30 years | 0.1 | 0.0 | 0.0 | 0.1 | 0.3 | 0.0 | 0.0 | 0.1 | 0.1 | 0.7 | 1.5 |
| Previous 20 years | 0.1 | 0.0 | 0.0 | 0.1 | 0.2 | 0.0 | 0.0 | 0.1 | 0.1 | 1.1 | 1.9 |
| 10 year groups | |||||||||||
| [2007,2017) | 0.2 | 0.0 | 0.0 | 0.2 | 0.4 | 0.0 | 0.0 | 0.2 | 0.1 | 1.4 | 2.8 |
| [1997,2007) | 0.1 | 0.0 | 0.0 | 0.0 | 0.1 | 0.0 | 0.0 | 0.0 | 0.1 | 0.7 | 1.1 |
| [1987,1997) | 0.0 | 0.0 | 0.0 | 0.0 | 0.3 | 0.0 | 0.0 | 0.0 | 0.0 | 0.1 | 0.5 |
| 5 year groups | |||||||||||
| [2012,2017) | 0.2 | 0.0 | 0.0 | 0.2 | 0.4 | 0.0 | 0.0 | 0.2 | 0.0 | 1.0 | 1.0 |
| [2007,2012) | 0.2 | 0.0 | 0.0 | 0.2 | 0.4 | 0.0 | 0.0 | 0.2 | 0.2 | 1.8 | 4.6 |
| [2002,2007) | 0.0 | 0.0 | 0.0 | 0.0 | 0.2 | 0.0 | 0.0 | 0.0 | 0.0 | 1.2 | 1.0 |
| [1997,2002) | 0.2 | 0.0 | 0.0 | 0.0 | 0.0 | 0.0 | 0.0 | 0.0 | 0.2 | 0.2 | 1.2 |
| [1992,1997) | 0.0 | 0.0 | 0.0 | 0.0 | 0.4 | 0.0 | 0.0 | 0.0 | 0.0 | 0.2 | 1.0 |
| [1987,1992) | 0.0 | 0.0 | 0.0 | 0.0 | 0.2 | 0.0 | 0.0 | 0.0 | 0.0 | 0.0 | 0.0 |
| Year | |||||||||||
| 2017 | 0.0 | 0.0 | 0.0 | 0.0 | 0.0 | 0.0 | 0.0 | 0.0 | 0.0 | 1.0 | 1.0 |
| 2016 | 0.0 | 0.0 | 0.0 | 0.0 | 0.0 | 0.0 | 0.0 | 0.0 | 0.0 | 0.0 | 1.0 |
| 2015 | 0.0 | 0.0 | 0.0 | 1.0 | 1.0 | 0.0 | 0.0 | 0.0 | 0.0 | 0.0 | 0.0 |
| 2014 | 0.0 | 0.0 | 0.0 | 0.0 | 0.0 | 0.0 | 0.0 | 1.0 | 0.0 | 3.0 | 1.0 |
| 2013 | 0.0 | 0.0 | 0.0 | 0.0 | 0.0 | 0.0 | 0.0 | 0.0 | 0.0 | 1.0 | 0.0 |
| 2012 | 1.0 | 0.0 | 0.0 | 0.0 | 1.0 | 0.0 | 0.0 | 0.0 | 0.0 | 1.0 | 3.0 |
| 2011 | 0.0 | 0.0 | 0.0 | 0.0 | 0.0 | 0.0 | 0.0 | 0.0 | 1.0 | 3.0 | 12.0 |
| 2010 | 0.0 | 0.0 | 0.0 | 1.0 | 1.0 | 0.0 | 0.0 | 1.0 | 0.0 | 4.0 | 4.0 |
| 2009 | 1.0 | 0.0 | 0.0 | 0.0 | 0.0 | 0.0 | 0.0 | 0.0 | 0.0 | 1.0 | 3.0 |
| 2008 | 0.0 | 0.0 | 0.0 | 0.0 | 0.0 | 0.0 | 0.0 | 0.0 | 0.0 | 0.0 | 4.0 |
| 2007 | 0.0 | 0.0 | 0.0 | 0.0 | 1.0 | 0.0 | 0.0 | 0.0 | 0.0 | 1.0 | 0.0 |
| 2006 | 0.0 | 0.0 | 0.0 | 0.0 | 0.0 | 0.0 | 0.0 | 0.0 | 0.0 | 2.0 | 2.0 |
| 2005 | 0.0 | 0.0 | 0.0 | 0.0 | 1.0 | 0.0 | 0.0 | 0.0 | 0.0 | 3.0 | 1.0 |
| 2004 | 0.0 | 0.0 | 0.0 | 0.0 | 0.0 | 0.0 | 0.0 | 0.0 | 0.0 | 1.0 | 2.0 |
| 2003 | 0.0 | 0.0 | 0.0 | 0.0 | 0.0 | 0.0 | 0.0 | 0.0 | 0.0 | 0.0 | 0.0 |
| 2002 | 0.0 | 0.0 | 0.0 | 0.0 | 0.0 | 0.0 | 0.0 | 0.0 | 0.0 | 0.0 | 0.0 |
| 2001 | 1.0 | 0.0 | 0.0 | 0.0 | 0.0 | 0.0 | 0.0 | 0.0 | 0.0 | 0.0 | 0.0 |
| 2000 | 0.0 | 0.0 | 0.0 | 0.0 | 0.0 | 0.0 | 0.0 | 0.0 | 0.0 | 0.0 | 0.0 |
| 1999 | 0.0 | 0.0 | 0.0 | 0.0 | 0.0 | 0.0 | 0.0 | 0.0 | 0.0 | 0.0 | 0.0 |
| 1998 | 0.0 | 0.0 | 0.0 | 0.0 | 0.0 | 0.0 | 0.0 | 0.0 | 0.0 | 0.0 | 1.0 |
| 1997 | 0.0 | 0.0 | 0.0 | 0.0 | 0.0 | 0.0 | 0.0 | 0.0 | 1.0 | 1.0 | 5.0 |
| 1996 | 0.0 | 0.0 | 0.0 | 0.0 | 2.0 | 0.0 | 0.0 | 0.0 | 0.0 | 1.0 | 3.0 |
| 1995 | 0.0 | 0.0 | 0.0 | 0.0 | 0.0 | 0.0 | 0.0 | 0.0 | 0.0 | 0.0 | 0.0 |
| 1994 | 0.0 | 0.0 | 0.0 | 0.0 | 0.0 | 0.0 | 0.0 | 0.0 | 0.0 | 0.0 | 1.0 |
| 1993 | 0.0 | 0.0 | 0.0 | 0.0 | 0.0 | 0.0 | 0.0 | 0.0 | 0.0 | 0.0 | 1.0 |
| 1992 | 0.0 | 0.0 | 0.0 | 0.0 | 0.0 | 0.0 | 0.0 | 0.0 | 0.0 | 0.0 | 0.0 |
| 1991 | 0.0 | 0.0 | 0.0 | 0.0 | 1.0 | 0.0 | 0.0 | 0.0 | 0.0 | 0.0 | 0.0 |
| 1990 | 0.0 | 0.0 | 0.0 | 0.0 | 0.0 | 0.0 | 0.0 | 0.0 | 0.0 | 0.0 | 0.0 |
| 1989 | 0.0 | 0.0 | 0.0 | 0.0 | 0.0 | 0.0 | 0.0 | 0.0 | 0.0 | 0.0 | 0.0 |
| 1988 | 0.0 | 0.0 | 0.0 | 0.0 | 0.0 | 0.0 | 0.0 | 0.0 | 0.0 | 0.0 | 0.0 |
| 1987 | 0.0 | 0.0 | 0.0 | 0.0 | 0.0 | 0.0 | 0.0 | 0.0 | 0.0 | 0.0 | 0.0 |
| 1986 | 0.0 | 0.0 | 0.0 | 0.0 | 0.0 | 0.0 | 0.0 | 0.0 | 0.0 | 0.0 | 0.0 |
| 1985 | 0.0 | 0.0 | 0.0 | 0.0 | 0.0 | 0.0 | 0.0 | 0.0 | 0.0 | 0.0 | 0.0 |
| 1984 | 0.0 | 0.0 | 0.0 | 0.0 | 0.0 | 0.0 | 0.0 | 0.0 | 0.0 | 0.0 | 0.0 |
| 1983 | 0.0 | 0.0 | 0.0 | 0.0 | 0.0 | 0.0 | 0.0 | 0.0 | 0.0 | 0.0 | 0.0 |
| 1982 | 0.0 | 0.0 | 0.0 | 0.0 | 0.0 | 0.0 | 0.0 | 0.0 | 0.0 | 0.0 | 0.0 |
Distribution map
Distribution - 2017
This map shows the observed distribution of the Little Pied Cormorant for 2017.
The red circles are the grid cells where Little Pied Cormorant have been reported.
The transparency of the red circles indicate how many surveys sheets were submitted for that grid cell; the darker the red the more reliable the data. Of the 315 grid cells with reports, 83 had only one sheet; an example is grid number A11.
The size of the circle represents the reporting rate. The maximum reporting rate for Little Pied Cormorant was 100.0% (eg grid number Q15) and the minimum was 0.2% (eg grid number K15). 
Distribution - all years
This map shows the observed distribution of the Little Pied Cormorant for all years.
The red circles are the grid cells where Little Pied Cormorant have been reported.
The transparency of the red circles indicate how many surveys sheets were submitted for that grid cell; the darker the red the more reliable the data. Of the 703 grid cells with reports, 55 had only one sheet; an example is grid number X14.
The size of the circle represents the reporting rate. The maximum reporting rate for Little Pied Cormorant was 100.0% (eg grid number X14) and the minimum was 0.1% (eg grid number K15). 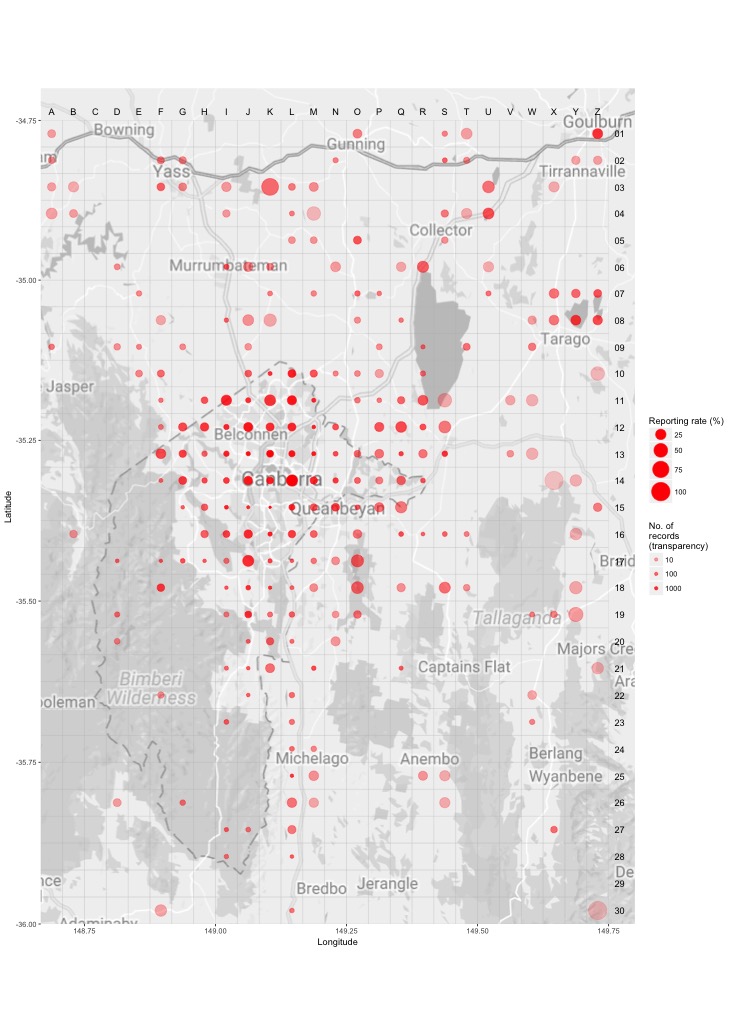
Breeding map
Breeding - 2017
This map shows the breeding distribution of the Little Pied Cormorant for 2017.
The red circles are the grid cells where breeding activity for Little Pied Cormorant have been reported.
The size of the circle represents the number of reports. 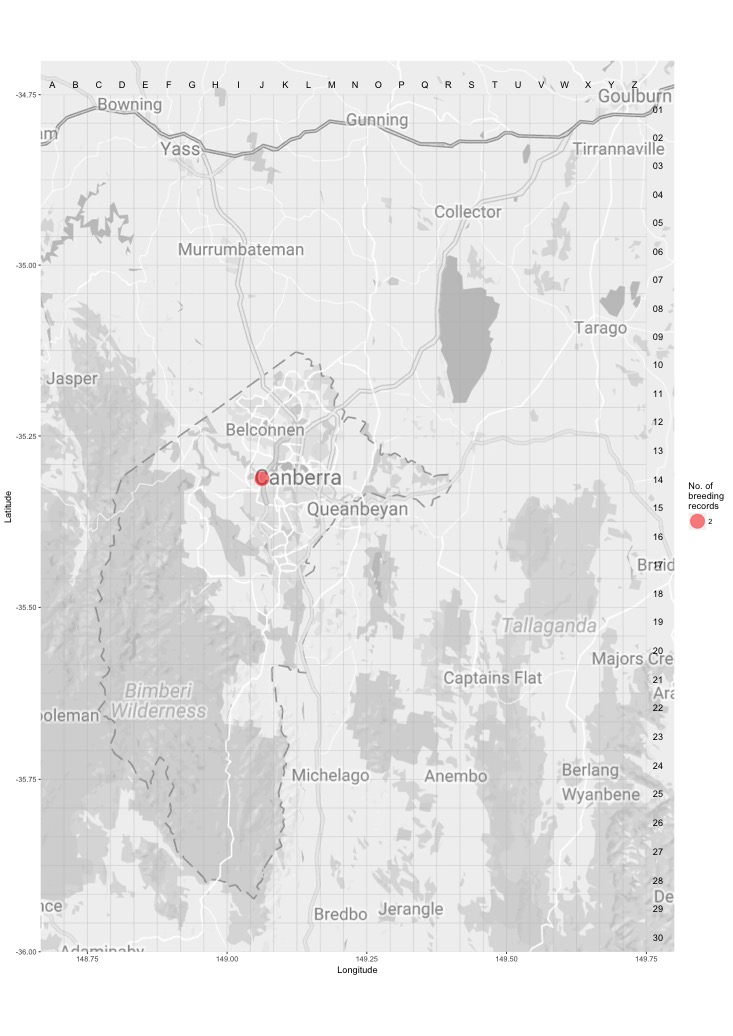
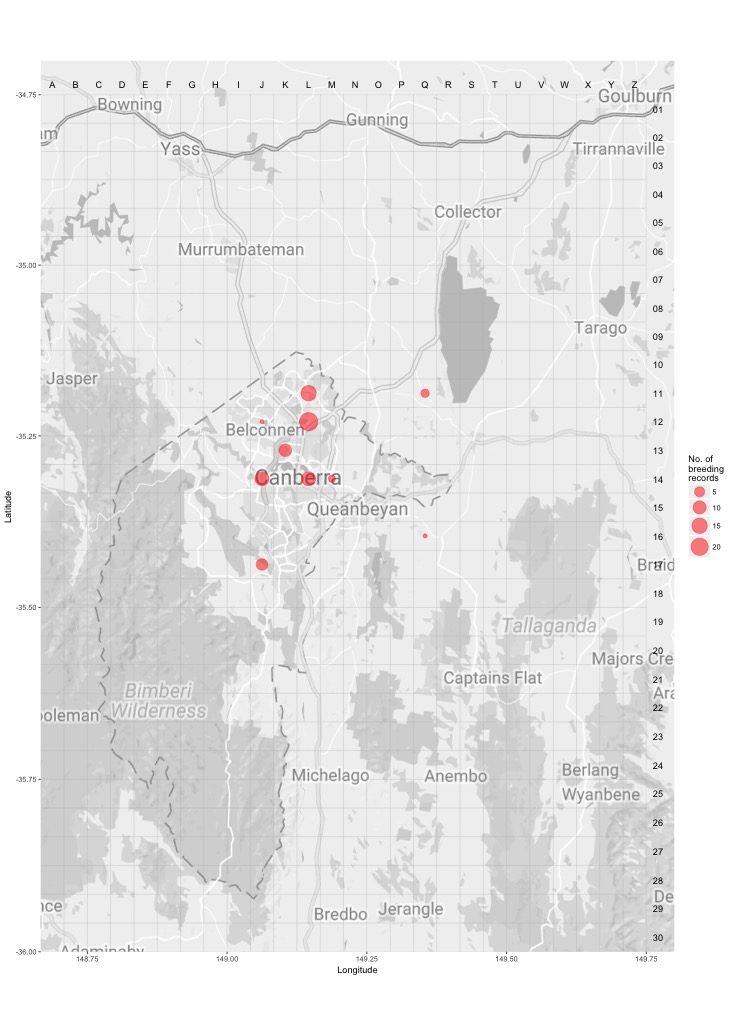
Breeding - all years
This map shows the breeding distribution of the Little Pied Cormorant for all years.
The red circles are the grid cells where breeding activity for Little Pied Cormorant have been reported.
The size of the circle represents the number of reports.